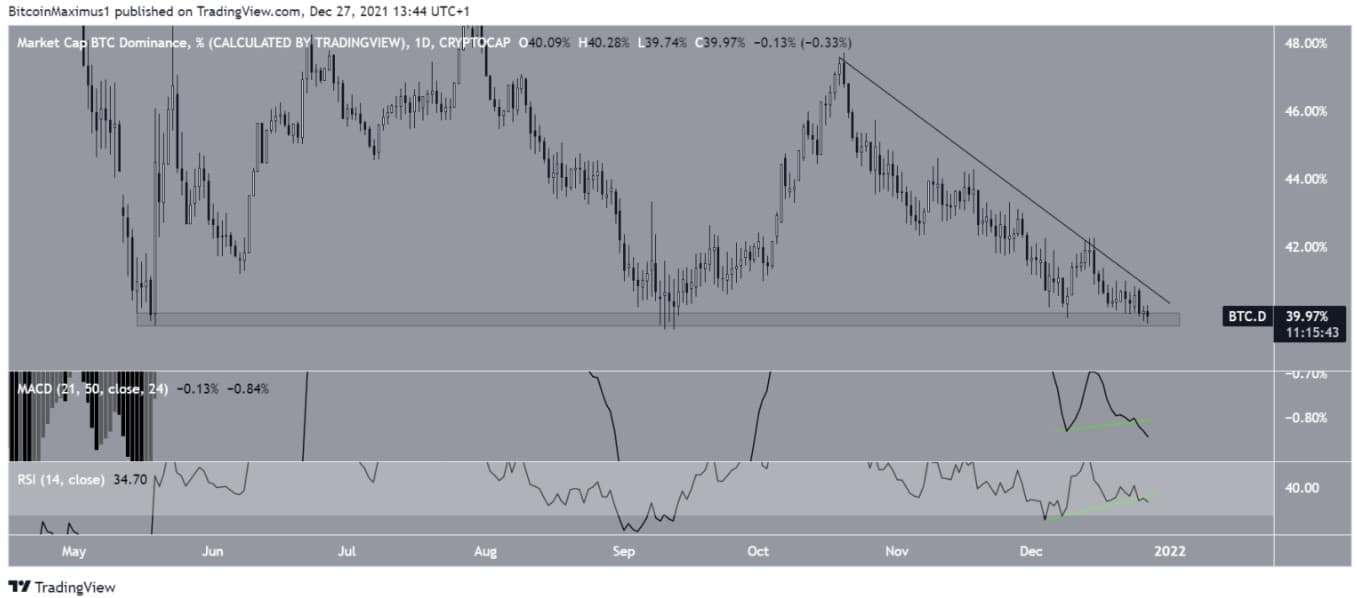
Seven months ago, BTCD declined to set a new low of 39.67% before a reverse in trajectory. While it seemed to start a solid bullish run, it didn’t sustain it and created a few lower highs instead. As of this writing, it is back to that 7-month low.
Bearishness On The Technical Indicators
This dip is proof that the 38.5% is a support region. BTCD has never dipped below 38% in the last three years. It would set a new all-time low if it dropped below this rate. Unfortunately, the technical indicators suggest that BTCD is set for a new all-time low. The MACD is below zero, with the short-term MA moving slower than the long-term MA. All of which are signs of bearishness.
Also, the histogram is thinning gradually. Furthermore, the RSI is below as its trendline is falling, indicating bearishness. All these factors suggest that a decline below 38% is possible. Famous crypto trader, Altcoinsherpa, analyzed a BTCD chart indicating a 46% fall in the BTCD rate ever since it achieved a 12-month peak. However, this drop rate may likely increase as the analysis shows that the BTCD bearishness isn’t over yet.
#Altcoins: Mini thread here on 'wen #Altseason'. Alt season has been going on for an entire year, you just haven't noticed it. Here's the #Bitcoin dominance chart- you can see alts have flourished since January 2021. $BTC $ETH pic.twitter.com/c2w1PjHrqV
— Altcoin Sherpa (@AltcoinSherpa) December 23, 2021
BTCD Analysis On The 24-Hour Chart
The chart analysis on the 24-hour timeframe agrees with the previous timeframes. BTCD has been following a dipping resistance line over the last two months. The RSI is no longer in sync with the trendline even it had previously created a bullish divergence along with the MACD.
(Advertisement)
CypherMind-HQ.com Artificial Intelligence Crypto Trading System – Get Ahead of the Curve with this sophisticated AI system! Harness the power of advanced algorithms and level up your crypto trading game with CypherMindHQ. Learn more today!
The MACD has also made a complete u-turn from the previously established bullish divergence. This timeframe also supports the notion of a continuous decline and setting a new all-time low.

BTCD 24-hour timeframe. Source: TradingView
Prediction Of BTCD Movement
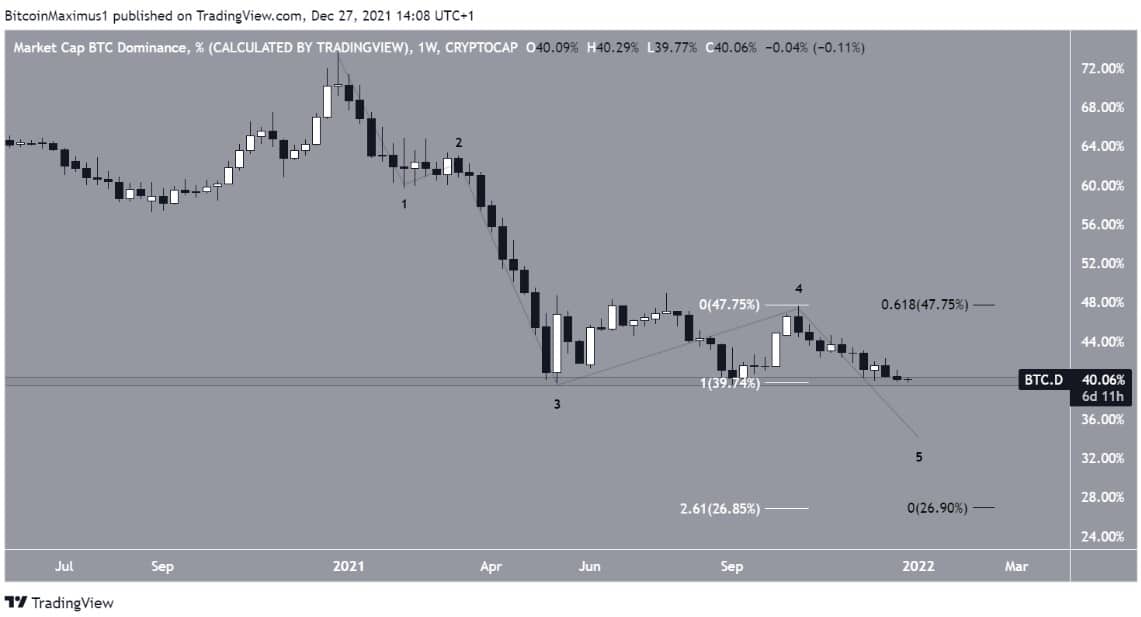
An analysis of the BTCD decline from January 2021 indicates a 5-wave downtrend, with BTCD currently in its final wave. The 26.5% level is the bottom of the whole BTCD downward movement. This level coincides with the 2.62 external fib retracement on the fourth wave. Also, this region is further confirmed by the 0.619 fib retracement of the first to the third wave, giving an almost similar target. Once this bottom level is reached, a new uptrend would likely follow.

The BTCD movement across the five waves. Source: TradingView
Bitcoin Trading Volume Exceeded $33B In 2021 – Block Research Data
A Block data survey has revealed that BTC and ETH futures trading volume exceeded $33B so far this year. The data also indicated that this figure represents an almost 340% surge in trading volume compared to last year. A breakdown of this data showed that trading volume for BTC and ETH was the highest in May 2021 as more than $4 trillion worth of BTC and ETH futures exchanged hands.
Also, the Binance crypto exchange is the leading exchange for BTC and ETH futures trades. This year also broke the record for spot trading volumes in the digital asset industry. Almost $15 Tr worth of trading volumes were handled by centralized exchanges, while decentralized exchanges dealt with more than $1.5 Tr worth.


