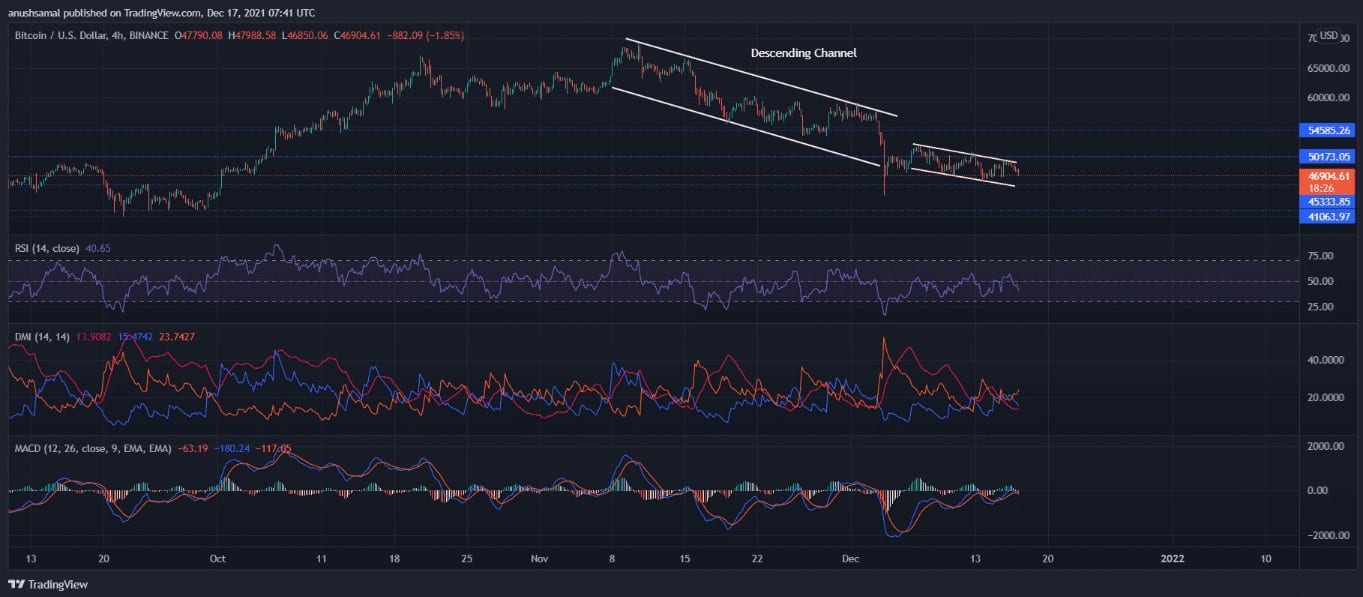
The technical signals indicate that BTC price will fluctuate between the $45.3K and $50.1K price range. BTC showed a marked recovery to rise above the $50K price level. But the leading digital asset had declined to $46.9K over the past 24 hours.
As it always happens, BTC price action affected other altcoins as they behaved similarly. Even though BTC had been trading in a descending channel (image below) since early last month, it displayed some recovery signs late last week. However, the recovery was short-lived as it returned to the descending channel before the weekend was over. Hence, the signals for BTC price action on the short-term timeframes indicate bearishness.
BTC Price Action On The 4-Hour Timeframe

4-hour chart BTC/USD. Source: TradingView
BTC’s high volatility over the past 24 hours has caused an extreme fear in the general market sentiment and, consequently, panic selling. This massive sell-off is a continuation of the sell-offs that have been happening in the last few weeks. The bulls’ failure to reverse the descending price movement during this period caused the BTC price to trade at sub-$50K levels.
(Advertisement)
CypherMind-HQ.com Artificial Intelligence Crypto Trading System – Get Ahead of the Curve with this sophisticated AI system! Harness the power of advanced algorithms and level up your crypto trading game with CypherMindHQ. Learn more today!
Yet, the technical signals don’t show any sign that BTC is about to reverse its current bearish trend. BTC will likely remain range-bound between $45.3K and $50.1k. Until BTC trades at over $55K and, more importantly, flips this price range as a support, this bearish will likely remain. The intense BTC selling pressure reflected a decline in the RSI. Also, the short-term bullishness displayed on the MACD disappeared.
LTC Price Action On The 4-Hour Timeframe

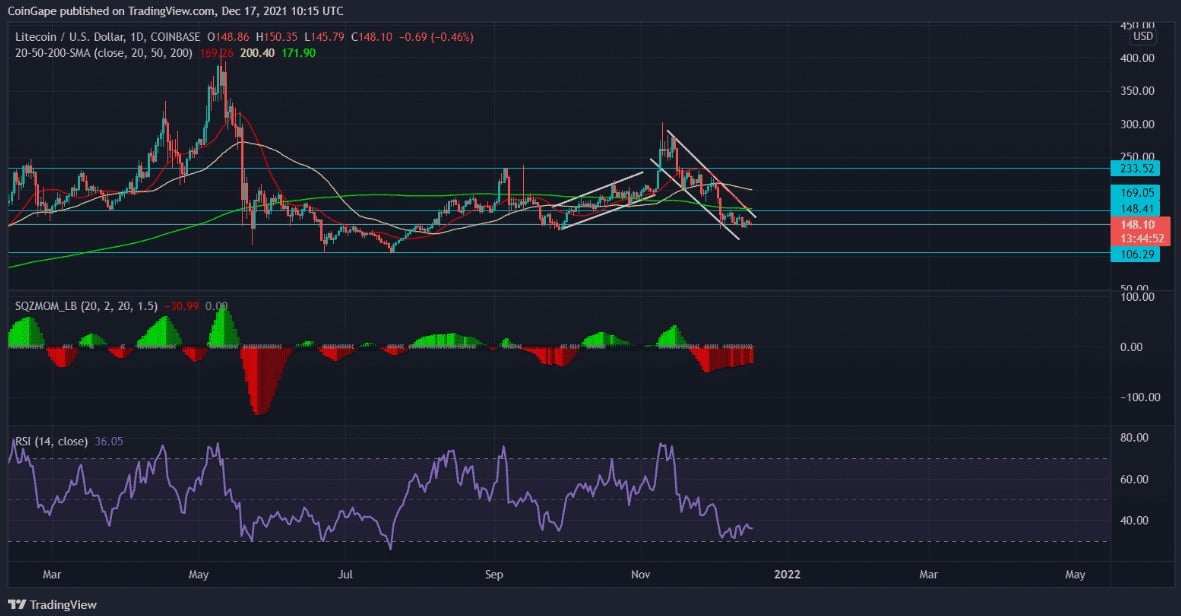
4-hour chart LTC/USD. Source: TradingView
Litecoin’s bullish move was halted and reversed when the general market sentiment turned negative. Litecoin has declined by almost 5% over the past 24 hours and currently trades at about $147. The technical indicators show that the bears are in control, with LTC’s next resistance at $149, while its next crucial resistance stands at $169.
If the market sentiment doesn’t move in its favor, Litecoin will find support at $106. The RSI indicates the bears will remain in charge as long as LTC price trades along the descending channel (as seen in the image above). Furthermore, if the LTC price remains below the price, which coincides with the 20 SMA region, LTC could dip by almost 32%.
ETH Price Action On The 4-Hour Timeframe

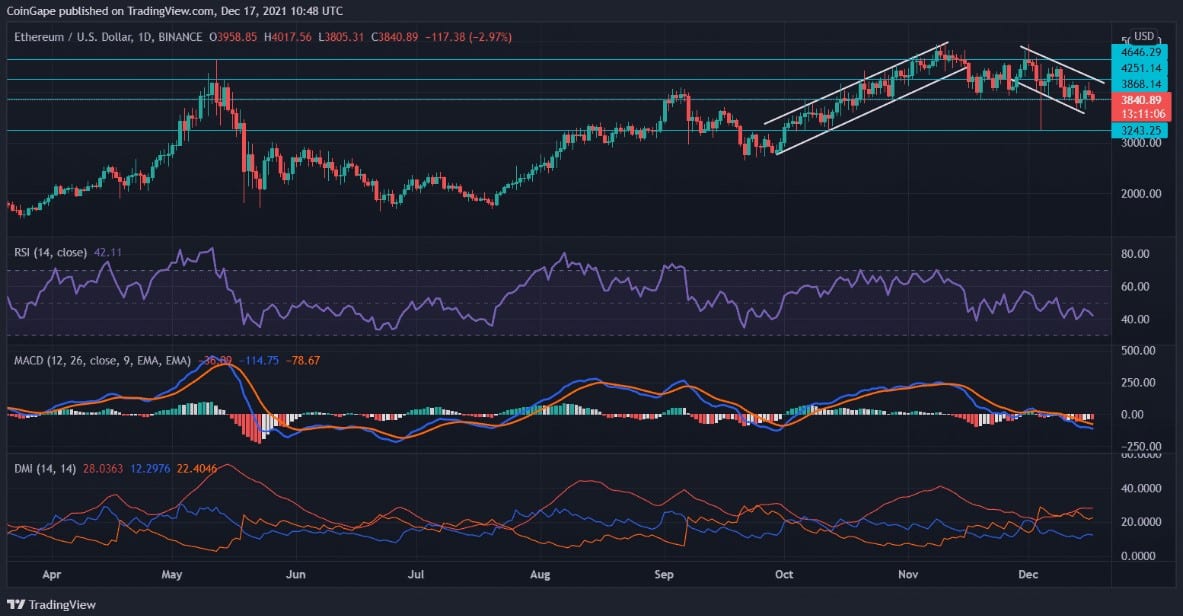
4-hour chart ETH/USD. Source: TradingView
ETH price traded in an up-channel between October and November but is now trading in a downtrend since the beginning of this month. It has declined by over 5% over the past 24 hours and, as of this writing, trades at $3.82K. ETH has retested and got rejected at the $4.65K price level (representing its next crucial resistance).
Its next support stands at $3.24K and may happen if the intense selling pressure, as seen over the last few weeks, continues. The RSI is declining, while the MACD is in the negative region, with both signals confirming the bearish trend.


